
Financial Performance Dashboard
A financial reporting demonstration using synthetic monthly sales data. Explore revenue, costs and margin, with a reference explaining how the measures are calculated.
Project overview
A financial reporting demonstration using synthetic monthly sales data. Explore revenue, costs and margin, with a reference explaining how the measures are calculated.
Original demonstration using synthetic information or conceptual assumptions. This is not verified client work. Engineering material is not approved for manufacturing or construction.
Objectives
- Define revenue, direct costs and gross margin consistently.
- Compare full-year and half-year synthetic figures.
Tools and concepts
Methodology
- Use one invented record per month for 2025.
- Calculate period totals before calculating the margin.
- Compare reporting periods and explain excluded operating costs.
Interactive demonstration
Synthetic values for demonstration. Revenue less direct costs equals gross profit.
Preview context
The photograph or code-based preview above is illustrative. The PDF pages below contain the reference material.
Learning outcomes
- Distinguish gross profit from net profit.
- Avoid averaging monthly margins to calculate a period margin.
PDF preview
Loading page...
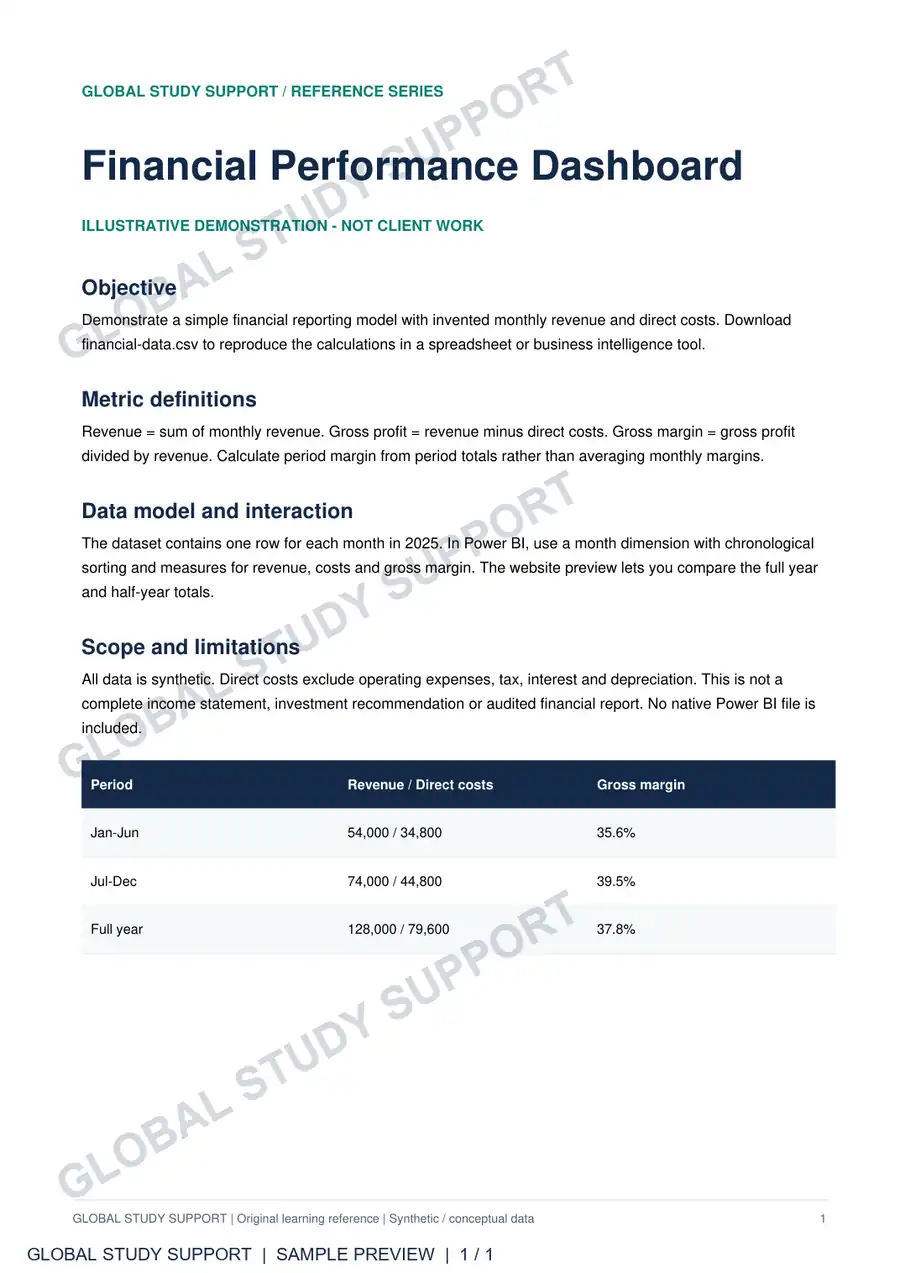
Page 1 of 1. Reference preview.
Reference for viewing and evaluation only. Contact us to discuss guidance for a similar project.
A challenge in mind?
Let’s work through it.
Share your goals. We’ll help you find a clear way forward.